Metrics view
The metrics view provides insight into how the skeletons may perform at runtime.
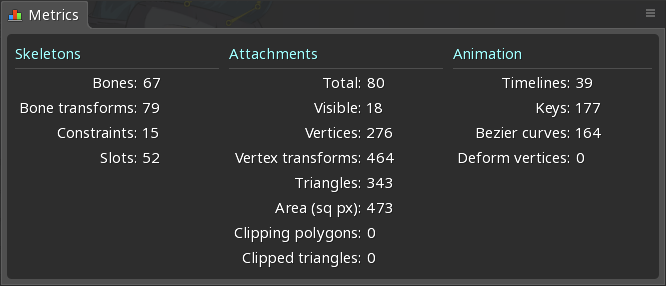
The metrics shown are the sum for all visible skeletons.
The animation metrics are only shown in animate mode.
Skeletons
Bones
The total number of bones in the skeletons.
Computing a bone's world transform uses the CPU. It is relatively cheap, but can add up with many skeletons on screen that each have many bones. For example, if each skeleton has 30 bones and 50 of these skeletons are on screen at once, bone 1500 world transforms need to be computed.
At runtime, once a skeleton is posed by manipulating the local bone transforms (often by applying an animation), the world transforms for each bone are computed (typical code). Usually this happens when Skeleton updateWorldTransform is called.
On the desktop, many thousands of bones are generally not a problem. On mobile, more than a couple thousand bones may be an issue. For example, in some tests, a Nexus 4 can handle about 2000 bones before the framerate drops below 60 frames per second.
Constraints
The total number of constraints in the skeletons.
Computing constraints uses the CPU. The computations are relatively cheap, but can add up with many skeletons on screen that are using constraints.
IK constraints with 1 bone are quite cheap (typical code) while 2 bone IK requires more operations (typical code, though some code paths are rarely taken).
Transform constraints don't require many operations, though they are applied for each constrained bone (typical code).
Path constraints require quite a few operations, dependent on how many vertices and constrained bones the path has (typical code).
Slots
The total number of slots in the skeletons.
The number of slots has a negligible impact on performance. Since each slot can have 0 or 1 attachment visible, it indicates the maximum number of attachments that can be visible at any given time.
Attachments
Total
The total number of attachments in the skeletons.
The total number of attachments doesn't affect rendering performance and has a negligible affect on load time.
Visible
The number of visible attachments in the skeletons.
An attachment simply being visible may not affect rendering performance. For example, nothing is rendered for a bounding box attachment.
Vertices
The number of vertices for all visible attachments.
The number of vertices indicates how much geometry is sent to the GPU.
Vertex transforms
The number of vertices that are transformed for all visible attachments.
Transforming a vertex uses the CPU. The computations are relatively cheap, but can add up with many skeletons on screen. The vertex count and how many bones have weight for each vertex determines the number of vertex transforms.
Similar to bones, attachment vertices need to be transformed from local to world coordinates (typical code: region attachments, mesh attachments).
Triangles
The number of triangles for all visible region and mesh attachments.
The number of triangles indicates how many vertex indices are sent to the GPU.
Area
The number of pixels drawn when the skeletons are drawn at full size. This includes transparent pixels and pixels that are drawn multiple times due to overdraw.
The number of pixels drawn indicates how much GPU fill rate is used to render the skeletons.
Clipping polygons
The number of convex clipping polygons. If the clipping attachment vertices are concave, they are decomposed into two or more convex polygons.
The best case for performance is when each clipping attachment is convex, resulting in one clipping polygon. Multiple clipping polygons increases the number of clipped triangles. See clipping performance for more information.
Clipped triangles
The number of attachment triangles clipped by the visible clipping attachments.
It is best for performance to clip as few triangles as possible. See clipping performance for more information.
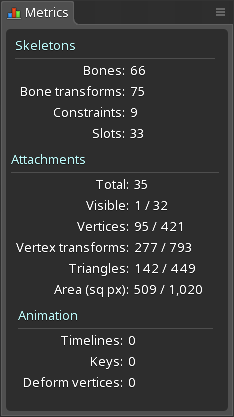
Selection
When one or more attachments are selected, two sets of numbers are shown for some metrics. The numbers before the forward slash are for the selected attachments. The numbers after the forward slash are for all attachments.
Animation
Timelines
The total number of timelines for the currently active animations.
Applying timelines uses the CPU. Applying a single timeline is relatively cheap, but can add up when many skeletons each have animations applied every frame. Also, multiple animations may be applied to a single skeleton each frame. For example, when running and shooting at the same time, or when animations are mixed for cross fading.
At runtime an animation is made up of a number of "timelines". Each timeline has a list of key values. When an animation is applied, each timeline for the animation is applied. The timeline looks through its list to find the key values for the current animation time, then manipulates the skeleton with those values (typical code). Even a timeline that has only 1 key at frame 0 is still applied every time the animation is applied to the skeleton.
Performance
Performance is interesting because it is either a big problem or not a problem at all. Even the worst application running on terrible hardware doesn't need optimizations as long as the performance is acceptable. The rule is: if improving performance would not be noticeable to the user, then any time spent improving performance is a complete waste. That time is always better spent on things noticeable to the user. In fact, optimizing more than necessary can reduce the quality of your animations and make your software more complex and harder to maintain, so it's important not to optimize needlessly.
This doesn't mean performance should be ignored during development, only that minimal performance considerations should be made as preemptive attempts to avoid performance problems. It's very easy to go too far and waste time, especially when so many variables are involved:
- what hardware the application is running on,
- everything done by the application and game toolkit besides rendering skeletons,
- how the game toolkit and Spine runtime perform rendering,
- how many skeletons are rendered,
- how those skeletons are configured,
- how many pixels are drawn,
- and much more.
When designing Spine animations, it's impossible for animators to take all of this into account and only deliver assets that perform well. Instead, reasonable effort should be made to avoid wasting performance, such as only using the number of mesh vertices required for the desired deformations. Only after a performance problem occurs should additional effort be made to simplify the skeletons.
Performance relies on so many variables that it isn't possible to generalize about which numbers in the metrics view are too high. If you intend to push performance to its limits, you will need to perform your own tests using your actual skeletons and the rest of your application on a variety of hardware to get an idea of the limits in your specific environment. If you aren't pushing the CPU or GPU to its limits, then there is no need to spend time worrying about performance or to sacrifice the quality of your animations.
If a performance problem is encountered, the first step is to identify the bottleneck that has the largest impact on performance, since focusing efforts there results in the largest gains. The most common bottlenecks when rendering Spine skeletons are CPU usage, fill rate, and draw calls.
CPU usage
When CPU usage is too high, it means your application uses so much CPU that rendering falls below an acceptable frame rate (typically below 60 or 30 frames per second). The most important metrics for CPU usage are bones, timelines, vertex transforms, constraints, and clipping. Any of these can be an issue if used in excess.
Using weights can greatly increase the number of vertex transforms, depending on the vertex count and how many bones have weight for each vertex. Using prune may reduce the number of vertex transforms.
The number of timelines increase the processing needed to apply an animation. Animation clean up may reduce the number of timelines.
Clipping is very expensive and should be avoided whenever possible, such as when the overdraw can be masked by other images. When clipping is used, it should be convex, use as few vertices as possible, and clip as few triangles as possible.
There may be options besides reducing the complexity of your skeletons. If you have many skeletons, it may be acceptable to only update a subset of them each frame, in a round-robin fashion. Another option may be to only animate a small number of skeletons and use those poses to render a larger number of skeletons.
Fill rate
When GPU fill rate is exhausted, it means you are trying to draw more pixels than the GPU can draw at an acceptable frame rate. Each time a pixel is drawn it counts against the fill rate. This is true even when the pixel is completely transparent or when the same pixel is drawn multiple times (this is called "overdraw"), for example when attachments overlap.
The solution to being fill rate limited is always the same: draw fewer pixels. Meshes can be used to avoid drawing transparent pixels, though this likely means more vertices to transform on the CPU. Completely transparent pixels still use up fill rate, so attachments should be hidden rather than their alpha set to zero. Sometimes art can be constructed in a way to minimize overdraw, for example by using a single, larger image in place of two or more overlapping images.
Draw calls
Asking the GPU to draw can be an expensive operation because it may need to finish what it is doing before accepting a new drawing task. If asked to draw too many times, the GPU won't be able to complete all of the drawing with an acceptable frame rate.
Most game toolkits batch up as much geometry as possible so the GPU is asked to draw fewer times. Usually a batch needs to be flushed when the GPU needs to draw from a different texture, so a texture atlas is used to reduce texture switches. Using blending for slots may also cause a batch flush.